- INTRO - Definition, examples of bad and good access to education, notable programs and organizations
--------------------------------------------------------------------------------------------------------------------------------------------------------------------------------------------------------------------------------------------------
-History of Education in the US (brief)
- History of Education in Bloomington - Normal (in depth)
--------------------------------------------------------------------------------------------------------------------------------------------------------------------------------------------------------------------------------------------------
-Options of Education-
Public Schools
In Bloomington-Normal there are two public school districts those being Unit 5 and District 87, and two alternative learning/behavioral schools. Regional Alternative School and Youth Build. There are also two private universities as well as one community college.
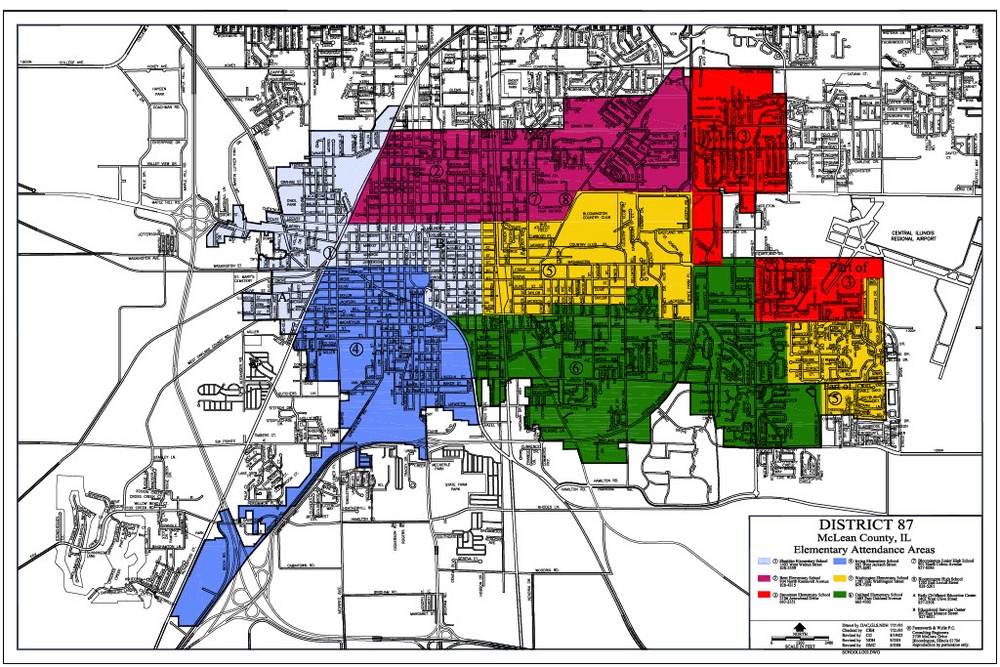
District 87 has a total of eight schools, they are as follows :
Bloomington High School, Bloomington Junior High School, Stevenson Elementary, Bent Elementary, Oakland Elementary, Irving Elementary, Sheridan Elementary, Washington Elementary
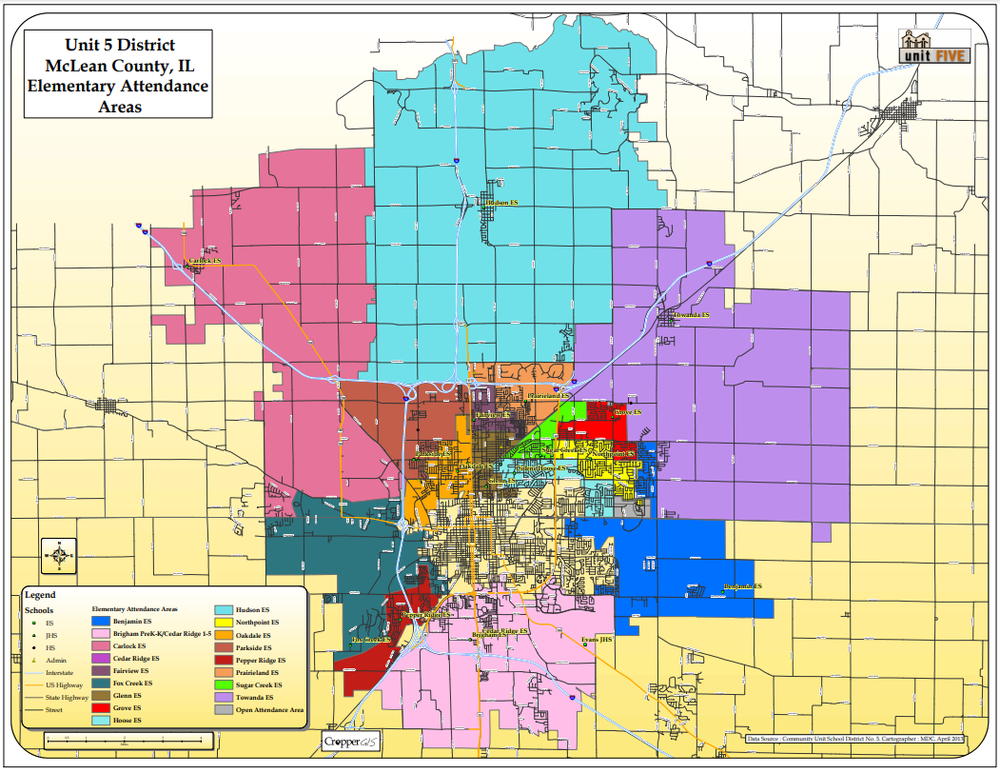
Unit 5 has a total of twenty-three schools, they are as follows :
Normal Community West High School, Normal Community High School, Chiddix Junior High, Evans Junior High, Kingsley Junior High, Parkside Junior High, Benjamin Elementary, Brigham Elementary, Carlock Elementary, Cedar Ridge Elementary, Colene Hoose Elementary, Fairview Elementary, Fox Creek Elementary, Glenn Elementary, Grove Elementary, Hudson Elementary, Northpoint Elementary, Oakdale Elementary, Parkside Elementary, Pepper Ridge Elementary, Prairieland Elementary, Sugar Creek Elementary, Towanda Elementary
Alternative Schooling / Charter Schools
-
Mulberry School http://www.mulberryschool.org/
-
Bloom Community School https://www.bloomcommunityschool.org/
-
Epiphany catholic school https://www.epiphanyschools.org/
-
Bright horizons https://www.brighthorizons.com/
-
Calvary Christian Academy https://ccanormal.org/
-
Metcalf School https://metcalf.illinoisstate.edu/
-
U High https://uhigh.ilstu.edu/
-
La Petite Academy of bloomington https://www.lapetite.com/
-
Cornerstone Christian Academy https://www.cornerstonechristian.com/
-
Central Catholic High School https://www.cchssaints.org/
-
Midwest Christian Academy https://midwestchristianacademy.com/
-
Corpus Christi Catholic School https://www.corpuschristisaints.org/
-
Trinity Lutheran School https://www.trinluthschool.org/
-
White Horse Academy https://www.whitehorseclassical.org/
-
Youth Build https://www.youthbuildmcleancounty.org/mission-1
Work Programs / Trade schools
-
BACC - Bloomington Area Career Center
-
Paul Mitchell School of Cosmetology
-
Bloomington Normal Barber College
-
Trade Courses at HCC
Local Wiki Links
--------------------------------------------------------------------------------------------------------------------------------------------------------------------------------------------------------------------------------------------------
-Quality of Education-
Standards, Subjects + Resources
Grades + Student Behavior
--------------------------------------------------------------------------------------------------------------------------------------------------------------------------------------------------------------------------------------------------
-Statistics-
Demographics of Students
Race + Gender
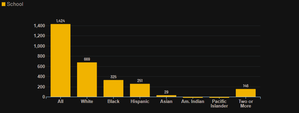
Typically the demographics amongst the different districts and schools average around the same numbers, excluding private schools. Bloomington High School reported in 2023 that of a total 1,424 students, 46% were Caucasian, 22% African - American, 17% Hispanic, 2% Asian, and 10% ‘two or more’. While Normal Community High School reported that of a total 2,089 students 59% were Caucasian, 14% were African - American, 9% Hispanic, 11% Asian, and 5% were ‘two or more’.
Graduates + Dropouts
Bloomington High School has reported in the last three years, 2021-2024, an average of 88.8% graduation rate. And comparatively, they have an average dropout rate of 4.46%.
Location / Neighborhood
 District 87 Boundary Map - Elementary
 Unit 5 Boundary Map - Elementary
--------------------------------------------------------------------------------------------------------------------------------------------------------------------------------------------------------------------------------------------------
-Comparing Schools-
Funding
There is a notable difference in funding not just amongst school districts, but even within the school districts. Take for example the lowest funded elementary school in district 87, Oakland elementary, compared to the highest funded, Stevenson Elementary. Noticeably there is a Five Thousand Dollars difference in funding per student (Illinois State Board of Education). Further comparing these schools shows many possible results of this funding difference. Oakland Elementary has, on average, a 10% higher truancy rate than Stevenson Elementary, and 10% less students with IEPs, IEPs being “Individualized Education Program”.
All this being said, Oakland Elementary scores 10% higher on IAR, or Illinois Assessment of Readiness Performance, than Stevenson Elementary. With scores of 25.8% at Oakland, to the 11.6% at Stevenson (Illinois State Board of Education).
- Staff Salary
- State Budget
- Resource Spending
- Condition of Equipment + Building
- Post Secondary Enrollment
- Public Vs. Private
---------------------------------------------------------------------------------------------------------------------------------------------------------------------------------------------------------------------------------------------------------
- SOURCES / REFERENCES -
Works Cited
Illinois Reading Council. “IRC - Home Page.”
https://www.illinoisreadingcouncil.org/. Accessed 20 February 2024.
Illinois State Board of Education. “BLOOMINGTON HIGH SCHOOL | Dropout Rate By Demographics.” Illinois Report Card,
https://www.illinoisreportcard.com/school.aspx?source=studentcharacteristics&source2=dropoutrate&Schoolid=170640870250001. Accessed 20 February 2024.
Illinois State Board of Education. “BLOOMINGTON HIGH SCHOOL | Enrollment By Demographics.” Illinois Report Card,
https://www.illinoisreportcard.com/school.aspx?source=studentcharacteristics&source2=enrollment&Schoolid=170640870250001. Accessed 20 February 2024.
Illinois State Board of Education. “Evidence-Based Funding.” Illinois State Board of Education,
https://www.isbe.net/Pages/EvidenceBasedFunding.aspx. Accessed 20 February 2024.
Illinois State Board of Education. “ILLINOIS | Postsecondary Enrollment.” Illinois Report Card,
https://www.illinoisreportcard.com/state.aspx?source=trends&source2=postsecondaryenrollment&Stateid=IL. Accessed 20 February 2024.
National Center for Education Statistics. “COE - Public High School Graduation Rates.” NCES, May 2023,
https://nces.ed.gov/programs/coe/indicator/coi/high-school-graduation-rates. Accessed 20 February 2024.
Bloomington Public Schools District 87. "Schools and Facilities." District 87,
https://www.district87.org/page/schools-and-facilities. Accessed 2 April 2024.
Bloomington Public Schools District 87. "Home Page." District 87,
https://www.district87.org. Accessed 2 April 2024.
---------------------------------------------------------------------------------------------------------------------------------------------------------------------------------------------------------------------------------------------------------
- GRAPHICS -
Illinois Dropout Rates by Demographics of BHS
Illinois Enrollment Rates by Demographic
Illinois Postsecondary Enrollment Data


